
Overview of the US Stress Test Scenarios Vs. the European Scenarios
Perspectives
Overview of the US Stress Test Scenarios Vs. the European Scenarios
Fri 23 Mar 2018
On February 1, 2018, just one day after the European Banking Authority (EBA) officially kicked off its EU-wide stress test exercise, the Federal Reserve Board (FRB) released the applicable scenarios for its own US stress test.
2018 US Stress Test Scenarios Overview
The annual stress test exercise is required by a provision of the Comprehensive Capital Analysis and Review rules (CCAR) and the Dodd-Frank Act Stress Testing rules (DFAST). For 2018, 38 large firms will be subject to this quantitative assessment, with results on capital planning and stress testing to be submitted before April 5, 2018. The results are expected to be released by the FRB by the end of June 2018. The scope includes six European bank subsidiaries which will also be part of the EU stress test at the parent company level.
The FRB has defined three scenarios to be used for the exercise, including a severely adverse scenario representing a significant downturn in the global economy.
The main characteristics of those scenarios are presented in the table below.
| Main US assumptions overview | Baseline scenario | Adverse Scenario | Severely Adverse Scenario |
| Trend | Moderate expansion through the projection period | Moderate recession from Q1-18 to Q1-19 followed by moderate growth period | Severe global recession |
| Real GDP rate | +2 to +2.5% | -2.25% then up to +3% in 2020 | up to -7.5% |
| Unemployment | Below 4% after mid 2018 | Rise, up to 7% in Q3-19 then around 6.25% | up to 10% in Q3-19 |
| CPI inflation | 2% to 2.25% | up to around 2% | below 1% in Q2-18 then rises up to 1.5% |
| ST Treasury yields | +1.5 to +2.5% | around 0 | around 0 |
| 10Y Treasury yields | +2.5% to +3.5% | +0.75% to +2% | unchanged |
| Equity Prices | around + 5% | up to -30% | up to -65% |
| Trend of Equity Market volatility | modest rise | rise | important volatility (VIX >60% in S1-18) |
| Nominal house prices | +2.5% to +3% | down to -12% | down to -30% |
| Commercial RE prices | rise up to 5% (2018-2019) then 3% | down to -15% | down to -40% |
| International variables | Asia : GDP growth up to 6% Japan : around 1.25% Euro Area : 2% then 1.5% UK : 1.5% | Moderate recession in euro area and UK pronounced recession in Japan, below trend growth in Asia | Sharp global downturn, with brief recession for Asia and severe recession everywhere else |
US vs. EU Stress Tests
48 large European banks will have to run the 2018 EU-wide stress test, the results of which will be published by November 2, 2018. While the EBA and the European Systemic Risk Board (ESRB)have included deviations to the baseline scenario to define adverse scenario assumptions, the FRB specifically defined a severely adverse scenario and requires projecting macro-economic assumptions on a quarterly basis.
| US ST scenario | European ST scenario | |
| Scenarios | 3 | 2 |
| Assumptions | 28 indicators projected quarterly | 11 indicators projected annually per country / area |
| Period covered by scenarios | Q1-2018 to Q1-2021 | Q1-2018 to Q4-2020 |
Whereas 11 macro-economic indicators are projected in Europe for each country and/or area, the set of 28 assumptions released by FRB integrates 18 indicators covering the US and three indicators for each the four jurisdictions, or country blocks, listed in its scenario (change in real gross domestic product (GDP), change in the consumer price index (CPI) and the US dollar exchange rate).
| Location | Areas covered by assumptions | # of assumptions |
| U.S. | Economic activity and prices | 6 |
| Asset prices or financial conditions | 4 | |
| Interest rates | 6 | |
|
Euro area / UK / developing Asia / Japan | Change in GDP | 4* |
| Change in CPI | 4* | |
| US FX Rate | 4* | |
| *each for the indicator is calculated for each location | ||
As the scenarios are not exactly based on the same set of assumptions, a straightforward line by line comparison between the US and EU scenarios is not practicable. Nevertheless, there are some common assumptions that we can compare below to analyze the trends and differences between the adverse (US and EU) and severely adverse (US) scenarios.
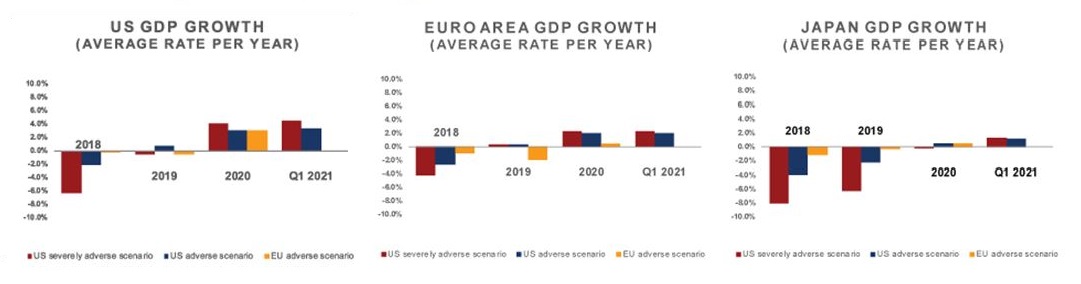
GDP Growth in US, Euro Area and Japan
Unemployment Rate in US
While the US unemployment rate follows a similar trend for 2018 under all scenarios, and for the first half of 2019 in the adverse scenarios for the US and EU, the FRB’s severely adverse scenario peaks at 10% in 2019 before declining while the ESRB scenario steadily increases.

US Real Estate Price Evolution
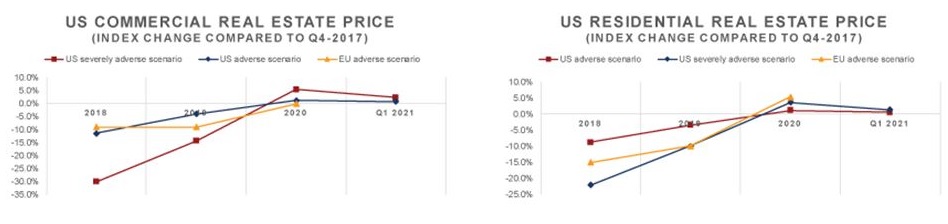
The EU assumptions for US real estate (both commercial and residential) are positioned between the adverse and severely adverse US assumption up to mid-2019, but consider a greater recovery after the second half of 2019.
Comparing data is not always easy, but it provides a broad picture of the capacity of larger financial institutions to absorb shocks and show resiliency. With some of the EU banks being challenged on both sides of the Atlantic, even if balance sheet and capital requirements as well as accounting principles are different, it will be interesting to look at the results and see how these scenarios will impact their solvency!
Want to get notified when new blog posts are published?
Subscribe